Learning eBPF for Observability, Optimization, and Security.
Published on: November 13, 2025
8 min read

Content
- 🧠 What is eBPF?
- ⚙️ How does eBPF work?
- 🧮 What is eBPF used for?
- 🚀 How to get started with eBPF?
- 🧑💻 Writing simple eBPF programs with BCC
- ✨ Conclusion
- 📚 Bibliography and recommended resources
🧠 What is eBPF?
eBPF (Extended Berkeley Packet Filter) is an advanced Linux technology that allows the safe execution of programs in the kernel space without the need to modify the code or load modules; providing an efficient and flexible way to monitor, analyze, and modify the behavior of the operating system in real time. eBPF has become an essential tool for observability, security, and performance optimization in Linux systems, although it is also supported on other platforms like Windows through projects such as eBPF for Windows and for embedded systems with projects like micro-BPF; here we will focus on its use and operation in Linux.⚙️ How does eBPF work?
This technology allows developers to write programs in a low-level language similar to C. These programs are compiled and converted into eBPF bytecode which is verified by the Linux kernel to ensure it is safe before being loaded and executed in kernel space. eBPF programs can be attached to various entry points in the kernel, such as system calls, network events, all points where information can be collected with perf, function tracing, and more; allowing great flexibility in its use.🧮 What is eBPF used for?
It is used for a variety of purposes, including:- Monitoring: allows the collection of system metrics and events in real time.
- Security: facilitates the implementation of security policies and intrusion detection.
- Performance optimization: helps identify bottlenecks and improve system efficiency.
- Networking: improves network traffic management and firewall implementation.
There are many projects and tools that leverage and facilitate the use of eBPF, some of them are:
- Cilium: a networking and security platform for containers that uses eBPF to provide network visibility and control.
- BCC (BPF Compiler Collection): a set of tools and libraries to create eBPF programs easily.
- bpftrace: a high-level tracing tool that makes it easier to write eBPF scripts for monitoring and debugging.
- libbpf: a library that provides an API to interact with eBPF from user-space applications.
🚀 How to get started with eBPF?
In this article, we will use eBPF one-liner commands to obtain basic system information and write a simple program using the BCC library in Python. Make sure you have a Linux environment with eBPF support (kernel 4.4 or higher) and the necessary tools installed. To start, we will install BCC and other necessary tools on a Debian/Ubuntu-based distribution:sudo apt-get update
sudo apt-get install bpfcc-tools linux-headers-$(uname -r) libbpfcc-dev python3-bpfccThe BCC tools include several useful scripts that we can use directly from the command line. For example, to monitor the files opened on the system, with information about the process that opened them and the file name, we can use the following command:
sudo /usr/sbin/opensnoop-bpfccWhile the command is running, open another terminal and run the “ls” command or open files to see how they are recorded in real time. To stop the execution and view the output, press Ctrl + C in the first terminal.

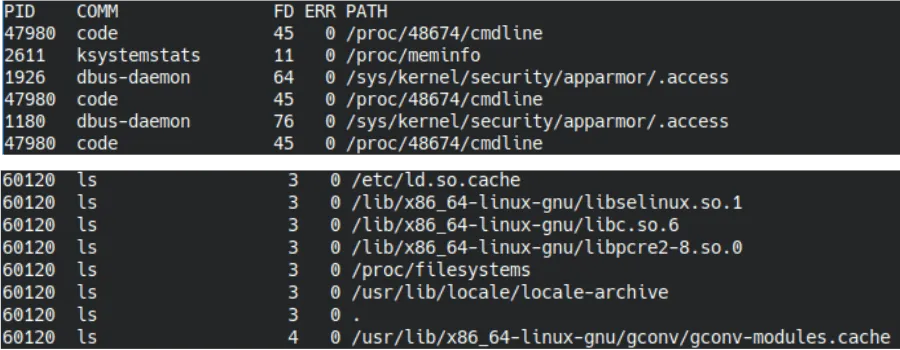
Output of the opensnoop-bpfcc command showing processes like code, ls, and the files they are opening.
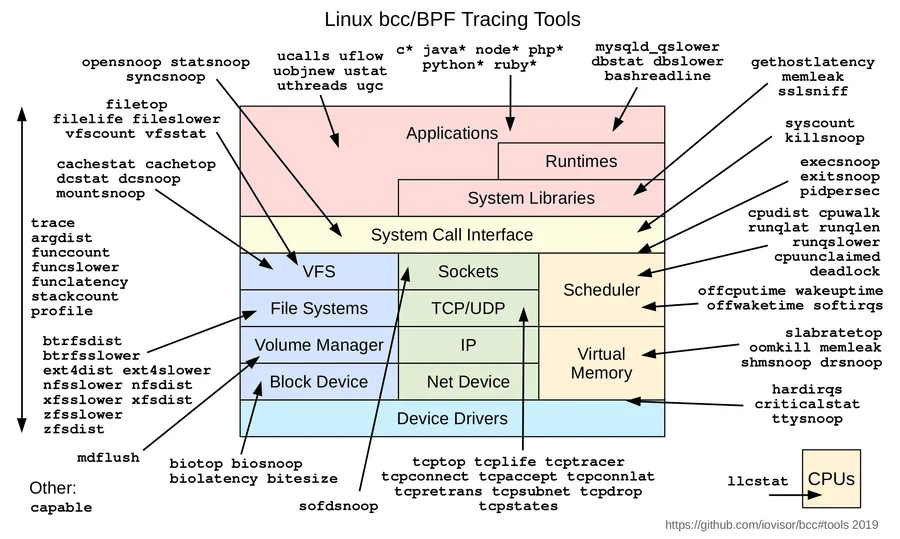
This command provides a real-time view of the files being opened on the system; in the example, we see processes like code and ls and the files they are opening. This information is useful for monitoring system activity and detecting unusual behavior. In the BCC repository, you will find eBPF scripts and one-liners that you can explore for different purposes, such as monitoring CPU usage, network activity, among others.

Diagram of tracing tools available in BCC.
🧑💻 Writing simple eBPF programs with BCC
Now, let’s write a simple eBPF program that prints: “Hola, mundo” every time a new process is created using the sys_clone system call. Create a file named hello_ebpf.py and add the following code:#!/usr/bin/python
#
# This is a Hello World example that formats output as fields.
from bcc import BPF
from bcc.utils import printb
# define BPF program
prog = """
int hello(void *ctx) {
bpf_trace_printk("Hola, mundo!\\n");
return 0;
}
"""
# load BPF program
b = BPF(text=prog)
b.attach_kprobe(event=b.get_syscall_fnname("clone"), fn_name="hello")
# header
print("%-18s %-16s %-6s %s" % ("TIME(s)", "COMM", "PID", "MESSAGE"))
# format output
while 1:
try:
(task, pid, cpu, flags, ts, msg) = b.trace_fields()
except ValueError:
continue
except KeyboardInterrupt:
exit()
printb(b"%-18.9f %-16s %-6d %s" % (ts, task, pid, msg))Save the file and run the script with superuser permissions:
sudo python3 hello_ebpf.pyNow, every time a new process is created on the system, you will see the message “Hola, mundo!” in the terminal output, along with information about the process that generated it. You can test this by opening new terminals and running commands like “ls”, “cat”, etc. To stop the execution, press Ctrl + C.

Output of the hello_ebpf.py program showing “Hello, world!” every time a new process is created.
The script uses BCC to define an eBPF program that attaches to the clone system call, which is responsible for creating new processes. Every time clone is called, the eBPF program prints the message to the kernel trace buffer, which is then read, formatted, and displayed in the terminal by the Python script.
⚠️ The bpf_trace_printk() function is simple but has limitations (maximum 3 arguments) and should only be used for testing. For production tools, BPF Maps or perf buffers are used for efficient data transfer between the kernel and user space.
Returning to our first one-liner opensnoop-bpfcc, let’s write a simplified version in Python using BCC. Create a file named open_files.py and add the following code:
#!/usr/bin/python

from bcc import BPF

prog = """
struct data_t {
    u32 pid;
    char comm[16];
    char filename[256];
};

BPF_PERF_OUTPUT(events);

TRACEPOINT_PROBE(syscalls, sys_enter_openat) {
    struct data_t data = {};

    // Obtener PID y comando
    u64 pid_tgid = bpf_get_current_pid_tgid();
    data.pid = pid_tgid >> 32;
    bpf_get_current_comm(&data.comm, sizeof(data.comm));

    // Leer filename desde los argumentos del tracepoint
    // args->filename contiene el puntero
    bpf_probe_read_user_str(&data.filename, sizeof(data.filename), (void *)args->filename);

    events.perf_submit(args, &data, sizeof(data));

    return 0;
}
"""

b = BPF(text=prog)

print("%-16s %-6s %s" % ("PROCESO", "PID", "ARCHIVO"))
print("=" * 80)

def print_event(cpu, data, size):
    event = b["events"].event(data)

    comm = event.comm.decode('utf-8', 'replace')
    filename = event.filename.decode('utf-8', 'replace').rstrip('\x00')

    # Solo imprimir si hay un nombre de archivo válido
    if filename and len(filename) > 0:
        print("%-16s %-6d %s" % (comm, event.pid, filename))

b["events"].open_perf_buffer(print_event)

print("Capturando... Presiona Ctrl+C para salir\n")

try:
    while 1:
        b.perf_buffer_poll()
except KeyboardInterrupt:
    print("\nFinalizando...")
Save the file and execute it with superuser permissions:
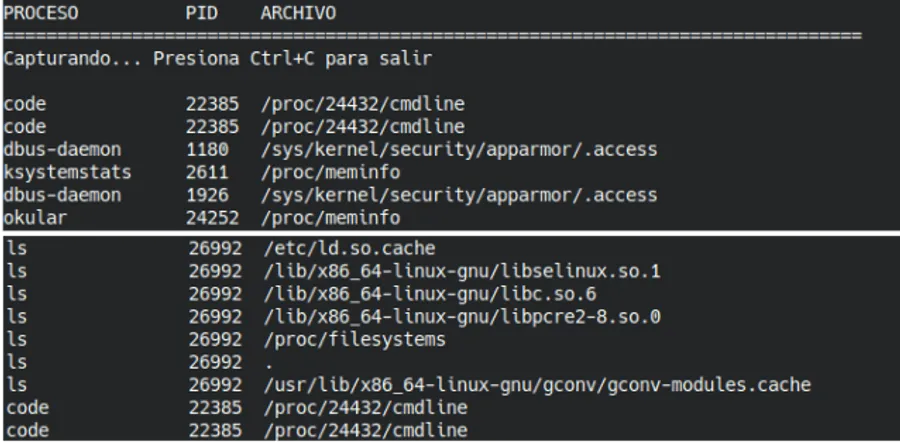
sudo python3 open_files.pyNow, every time a process opens a file, you will see the process name, its PID, and the file name in the terminal. You can verify this by opening another terminal and running commands that open files, such as “cat”, “ls”, etc.

Output of the open_files.py script capturing opened files with information about the process that opens them.
In this script, we again use the BCC library to load and execute an eBPF program that traces system calls for opening files using the tracepoint “syscalls:sys_enter_openat”. Brief explanation of the code:
-
The (data_t) structure is defined to store the process PID, command name, and the name of the opened file.
-
A tracepoint probe is used on sys_enter_openat which triggers every time a process calls the openat function to open a file.
-
In the probe, we obtain the PID and command name of the current process.
-
Then, we use bpf_probe_read_user_str to read the name of the opened file.
-
We send the information to user space through a perf events buffer (events.perf_submit).
-
In Python, a header is printed and a function is defined to receive events from the perf buffer and display the process, PID, and opened file in the console.
-
A loop is executed that listens for real-time events until interrupted with Ctrl+C.